Introduction
Data visualization has been around for a long time. It is essential because it helps people to understand complex data quickly and easily. It helps people to see the relationships between things.
For example, if you have a spreadsheet of different companies and their profits, you can visualize this information with charts.
In addition, You can see the overall trend. Data visualization can also help people make better-informed decisions. With data visualization, you will be able to see relationships that weren’t apparent before. People should know that it is a good idea to analyze data using data visualization.
Moreover, You should use data visualization to present your results to others. You should create charts to explain the results of your data analysis. You can even make infographics to share your findings. If you do this, you can help people understand your data analysis.
Why is Data Visualization Important?
Data visualization is important because it allows people to understand complex data quickly and easily. Traditional methods of data analysis, such as spreadsheets and tables, can be overwhelming and difficult to interpret, especially for non-experts.
Additionally, Data visualization allows people to see patterns, trends, and relationships in data that might not be apparent otherwise. It helps people understand the significance of the data and make better-informed decisions based on that understanding.
Further, Data visualization is also important because it can help people visualize large amounts of data. Often, people look at a spreadsheet or table and don’t really understand what it means.
Moreover, People can be overwhelmed by the sheer volume of data presented in these formats. Using data visualization, people can quickly gain insight into data that they might not have been able to recognize otherwise.
Importantly, Data visualization is also important because it can help people visualize big data sets. If a person wants to analyze data related to something like disease rates or crop yields, for example, she might need to look at a huge amount of data.
The Benefits of Data Visualization
Data visualization is an essential tool for businesses to make informed decisions. Here are some of the benefits of data visualization:
Improved Data Analysis
Businesses have been collecting massive amounts of data for many years. They now need to be able to understand the trends in that data. They have to be able to analyze that data and make smart business decisions. Many people think that they need to use large software packages to do this.
However, there are many other ways that businesses can do this. In this blog, we are going to discuss some of those methods. One of the biggest problems with analyzing data today is that it takes a lot of time. Businesses use complex programs to get this done. If you have ever used Excel, you will know how much time it takes to do basic calculations.
In addition, If you have thousands of rows in your spreadsheet, it will take hours to calculate. Businesses are looking for ways to make their work faster. They are hoping to find programs that can quickly process large amounts of data. The problem is that they have to spend a lot of money to get a program that does this.

Better Decision Making
Data visualization helps decision-makers to understand complex data quickly and easily. This enables them to make informed decisions based on data-driven insights, rather than relying on intuition or assumptions.
Further, Better decision making is a necessity in business. Data visualization plays a major role in the decision making process. Businesses are starting to use this strategy because they know that it’s important to make decisions that have solid data behind them.
Moreover, When you use visualization tools, you can make better decisions. You’ll be able to understand what the data is telling you. With data visualization, you will be able to make informed decisions. You should have this data analysis tool in your arsenal.

Increased Efficiency
Data visualization enables businesses to analyze data more efficiently, reducing the time required to make informed decisions. With data presented in a visual format, it is easier to identify areas that require further investigation or analysis.
Additionally, Data visualization is a process that involves using a combination of numbers and pictures to help people understand the information. Businesses use data visualization to help them to manage their businesses more effectively. Data visualization can help reduce costs and save time. It can be used to analyze a large amount of data in a short time, which can help to improve efficiency.

Improved Communication
Data visualization is an effective tool for communicating data and insights to stakeholders. By presenting data in a visual format, it becomes easier to convey complex information to non-technical stakeholders, improving communication and understanding.
Moreover, Visualizing data is an effective way to communicate information. We can show graphs, charts, or maps to visualize the data. The more information we present visually, the more we can share our findings with others. Data visualization is a powerful technique for helping us make sense of complicated numbers. If you have a big database, you can use graphs and charts to help you see patterns.
Importantly, Graphs can help you understand trends and show relationships between different data points. You can create a visualization using a variety of tools, including Excel, PowerPoint, and Tableau. You can use Google Charts for quick, easy, and free visualization. You can also use other tools for creating your own data visualization such as ArcGIS Online. You can create charts, maps, and reports using this tool.

Enhanced Collaboration
Collaboration among people can be very effective. There is no doubt about that. Many businesses, companies, and organizations today use collaboration to make progress. But the process isn’t always smooth sailing. We may be able to provide solutions to the problems that arise while collaborating, but it still seems like it will be a difficult task. Nowadays, it is very easy to communicate with each other.
In addition, There are plenty of ways to communicate with each other these days. And there are tools that can help us to connect with other people. These are called Data Visualization Tools. These tools can be used by many different types of teams.
For example, these tools can be used by an engineering team. But we can also use them in a marketing team, a finance team, or any other team that needs to collaborate. In most cases, these tools are very useful in making teams more productive.

Types of Data Visualization
Charts and graphs
There are different kinds of data visualization. The most common type of data visualization is a chart. A chart shows information in visual form. Charts and graphs are used to communicate data.
Further, Charts are often used to communicate simple data. If you want to explain a complicated situation, you can use a chart. If you want to present your audience with the information, you can use a chart. There are different types of charts and they include bar charts, line charts, pie charts, and scatter plots.
Moreover, A line chart is the simplest of the charts. The data is shown on a horizontal line and the values change from left to right. A pie chart shows the distribution of the data. It is used to compare proportions between two or more items.
Maps
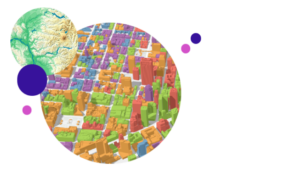
Maps can be used to show many different types of information. A map can be used to represent geographical locations. You can use maps to show the distance between locations. These maps can also be used to show the shortest route from one location to another.
Additionally, A map is made using points that are marked with some sort of icon. This can be done manually, or using software. It may even be done automatically. You can find various ways of using maps. For example, you can use maps to make presentations or to plan routes.
Further, It is possible to represent geographic data in several different ways. In general, a map is made by locating places, such as cities, on the ground and connecting those places with lines.
Infographics
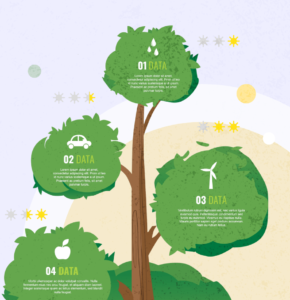
Infographics are a combination of text, images, and charts that tell a story about data. They are often used to simplify complex information and make it more accessible to a broader audience.
Further, Infographics can be a great tool to convey information. We should use them more often in order to save time and money. These visual tools are a good way to share information with others. They can be effective at getting people to pay attention to the information you are sharing.
Moreover, Infographics can help you to communicate effectively to a broad audience. You can include text and photos in a simple graphic and get people interested in the information.
Dashboards
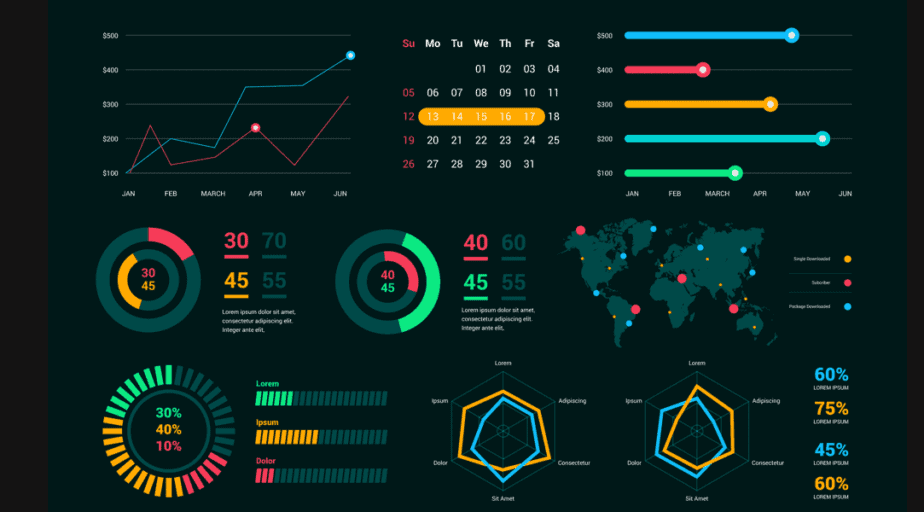
These days, many companies are using dashboards to monitor key performance indicators (KPIs). They are used to measure the efficiency of the company’s management and its employees. They can also help you to identify opportunities. A dashboard will help you to keep a close watch on your performance and to track your progress.
Further, A dashboard has charts, graphs, and other information that can help you to measure your performance. It can also help you to understand how your organization is doing. It is common to use charts and graphs to help you to analyze data. Dashboards can help you to learn about your company’s financials. They can help you to see if there is any improvement in your company’s profitability. Dashboards can be useful in many ways.
Conclusion
In today’s data-driven business landscape, the ability to analyze and interpret data effectively is crucial. Data visualization is an important tool that enables businesses to understand complex data more easily, improving efficiency, decision-making, and communication.
By using data visualization tools, businesses can gain a competitive edge by making informed decisions based on data-driven insights.
